Benchmarking Nuclei Segmentation on BBBC038
The bbbc038_segmentation_benchmark workflow compares nuclei segmentation methods on the same microscopy images and scores each prediction against reference instance masks.
It is a compact benchmark graph: the image preparation and reference labels are shared, while Cellpose3, Cellpose-SAM, StarDist, and a classical threshold method are evaluated side by side.
The data model follows BBBC038v1, the Kaggle 2018 Data Science Bowl nuclei dataset hosted by the Broad Bioimage Benchmark Collection. Each sample contains one raw microscopy image and one binary PNG mask per nucleus.
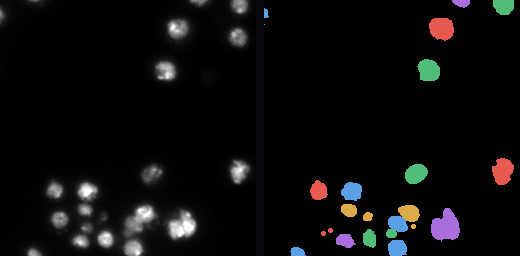
BBBC038 input preview. The left panel is the raw nuclei image. The right panel is the reference instance-label image assembled from the per-nucleus mask PNGs, with each nucleus shown in a different color.
Run the workflow from the repository root:
python example_workflows/bbbc038_segmentation_benchmark/workflow.py
Workflow Logic
The workflow builds one reference label image per sample, prepares the raw image for segmentation, runs each method, and then benchmarks every prediction against the same reference. Keeping the scoring step shared makes the metric rows directly comparable.
flowchart LR
  data[BBBC038 sample folders]:::source --> samples[bbbc038_samples]:::process
  samples --> reference[build_reference_labels]:::process
  samples --> prepare[prepare_segmentation_images]:::process
  prepare --> cp3[cellpose3_segmentation]:::method
  prepare --> cpsam[cellpose_sam_segmentation]:::method
  prepare --> stardist[stardist_segmentation]:::method
  prepare --> classical[classical_threshold_segmentation]:::method
  reference --> score[benchmark method outputs]:::metric
  samples --> score
  cp3 --> score
  cpsam --> score
  stardist --> score
  classical --> score
  score --> table[bbbc038_benchmark_metrics]:::metric
  classDef source fill:#e7f0ff,stroke:#4b73b9,color:#1b2f55
  classDef process fill:#edf8ef,stroke:#4d8f5b,color:#173d20
  classDef method fill:#f3eafd,stroke:#7d57a8,color:#332047
  classDef metric fill:#ffeceb,stroke:#b85b52,color:#4d201c
bbbc038_samplesfinds sample folders and records the raw image path and mask directory.build_reference_labelscombines the individual binary masks into one integer-labeled reference image.prepare_segmentation_imagesconverts the raw image to the 2D intensity image used by all methods.cellpose3_segmentationruns Cellpose v3 with the nuclei model.cellpose_sam_segmentationruns Cellpose-SAM on the same prepared image.stardist_segmentationruns the2D_versatile_fluoStarDist model.classical_threshold_segmentationruns a threshold-based segmentation method.The benchmark nodes compare each predicted label image with the reference labels and write one overlay per method.
bbbc038_benchmark_metricsconcatenates the per-method metric rows into the final table.
Workflow Outputs
The workflow writes the reference label image, the prepared segmentation input, one predicted label image per method, one overlay preview per method, and a benchmark table.
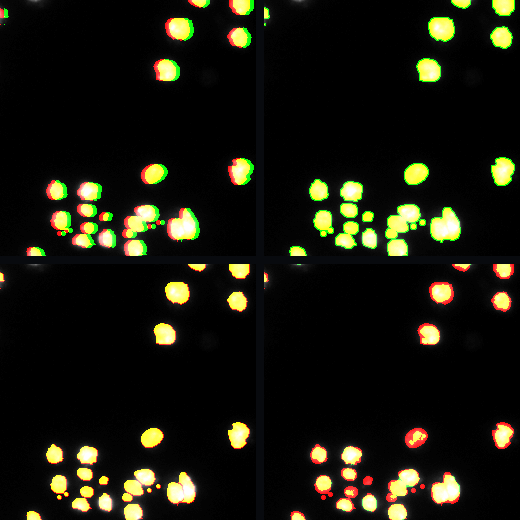
Output overlay preview for one BBBC038 image. Each quadrant shows one method result: Cellpose3, Cellpose-SAM, StarDist, and the classical threshold method. Red marks reference foreground, green marks predicted foreground, and yellow marks pixels where reference and prediction overlap.
The terminal table has one row per image and method. A typical row looks like this:
method |
predicted_label_count |
reference_label_count |
foreground_iou |
foreground_dice |
overlay_image |
|---|---|---|---|---|---|
|
|
|
|
|
|
The object counts show whether a method is splitting or merging nuclei, while IoU and Dice summarize foreground agreement. The overlay image is the quickest way to interpret those numbers, especially when two methods have similar scores but different error patterns.