FISH Spot Counting Per Nucleus
The fish_analysis workflow analyzes fluorescence in situ hybridization (FISH) images from the Cell Image Library (CIL) to quantify FOLS2 and CSF1R gene-marker spots inside segmented nuclei in breast cancer tissue samples.
The workflow processes three-channel microscopy images: channel 0 contains the green FOLS2 signal, channel 1 contains the red CSF1R signal, and channel 2 contains the blue nuclear stain. For each image in the batch, the analytical goal is to estimate the average number of FOLS2 and CSF1R spots per nucleus.
The execution downloads the CIL TIFFs and runs ATLAS-backed spot detection together with Cellpose-backed nuclei segmentation.
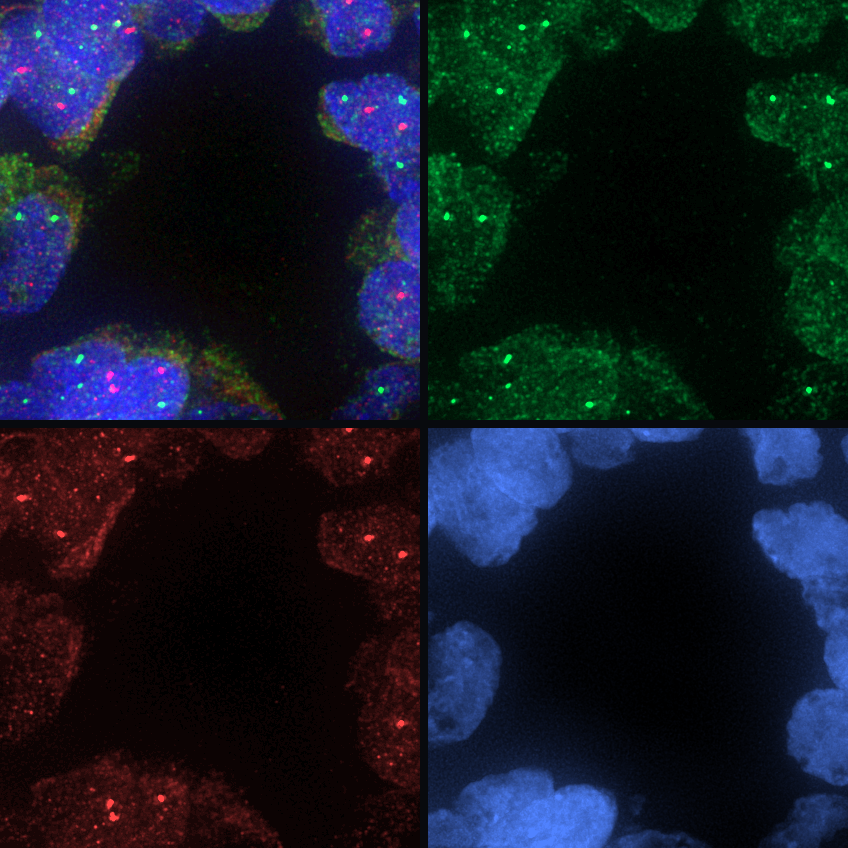
CIL record 13432 shown as a merged color crop, followed by the FOLS2 channel, the CSF1R channel, and the nuclei channel.
Run the workflow from the repository root:
python example_workflows/fish_analysis/workflow.py
The workflow stores raw CIL downloads under the configured data directory and writes BioImageFlow node outputs under the workflow storage path.
Workflow Logic
The pipeline demonstrates a branching topology.
One branch extracts the nuclei channel and segments nuclei once with Cellpose3.
Two parallel marker branches reuse the same marker-analysis Workflow with different channel indices before the overlap tables converge in a final statistical aggregation step.
flowchart LR
  cil[Cell Image Library TIFFs]:::source --> nuclei_channel[Extract channel 2]:::process
  nuclei_channel --> cellpose[Cellpose3 nuclei labels]:::seg
  cil --> fols2[MarkerSpotAnalysis: FOLS2, channel 0]:::spot
  cil --> csf1r[MarkerSpotAnalysis: CSF1R, channel 1]:::spot
  cellpose --> fols2
  cellpose --> csf1r
  fols2 --> stats[Average spots per nucleus]:::metric
  csf1r --> stats
  classDef source fill:#e7f0ff,stroke:#4b73b9,color:#1b2f55
  classDef process fill:#edf8ef,stroke:#4d8f5b,color:#173d20
  classDef seg fill:#f3eafd,stroke:#7d57a8,color:#332047
  classDef spot fill:#fff4d6,stroke:#a77a18,color:#4a3200
  classDef metric fill:#ffeceb,stroke:#b85b52,color:#4d201c
Data ingestion and preprocessing:
DownloadImagescreates a table of CIL image paths.ExtractChannelisolates channel 2, producing the nuclear image used by Cellpose3.Nuclei segmentation:
Cellpose3segments the nuclear channel and produces a label image in which each nucleus receives a distinct integer identifier.Spot detection for channels 0 and 1: The FOLS2 and CSF1R channels are processed independently by two invocations of the reusable marker-analysis
Workflow. Each instance extracts one marker channel, runsAtlasSpotDetection, converts the detection mask into connected-component spot labels, and measures spot-to-nucleus overlaps.Spatial correlation: The marker branches converge through
LabelOverlapsinside the marker-analysis workflow. These nodes output tables describing which spot labels overlap which nuclear labels rather than producing another image.Statistical aggregation:
AverageSpotsPerNucleusfilters background labels, groups spots by parent nucleus, and reports per-image averages and marker-specific totals.
Marker-analysis workflow
The marker module’s build_workflow factory creates the reusable branch that keeps the FOLS2 and CSF1R logic identical.
The parent invokes one fresh definition twice with different channel bindings.
flowchart LR
  image[Multi-channel FISH image]:::source --> extract[Extract marker channel]:::process
  extract --> atlas[AtlasSpotDetection]:::spot
  atlas --> cc[ConnectedComponents spot labels]:::spot
  nuclei[Cellpose nuclei labels]:::seg --> overlaps[LabelOverlaps]:::metric
  cc --> overlaps
  overlaps --> table[Overlap table]:::metric
  classDef source fill:#e7f0ff,stroke:#4b73b9,color:#1b2f55
  classDef process fill:#edf8ef,stroke:#4d8f5b,color:#173d20
  classDef seg fill:#f3eafd,stroke:#7d57a8,color:#332047
  classDef spot fill:#fff4d6,stroke:#a77a18,color:#4a3200
  classDef metric fill:#ffeceb,stroke:#b85b52,color:#4d201c
What you will inspect
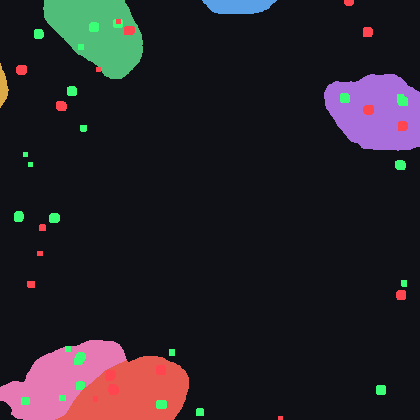
Output preview for the same CIL 13432 crop.
Cellpose nuclei are shown as color-coded labels; FOLS2 detections are overlaid in green and CSF1R detections are overlaid in red.
The terminal table contains one row per image with average FOLS2 and CSF1R spot counts per nucleus, the number of observed nuclei, the number of marker-positive nuclei, and marker-specific spot totals. When adapting the workflow, inspect the nuclei labels, marker detection masks, overlap tables, and overlay preview together; a high marker count is meaningful only when the segmentation and spot detection are plausible in the image.