Exploring ATLAS Spot Detection Parameters
The parameter_space_exploration workflow runs ATLAS spot detection over a small grid of parameter values.
It is useful when a FISH marker channel contains real spot signal, but the right detection threshold and spot scale are not obvious from a single run.
This demo is illustrated with fluorescence in situ hybridization images from the Cell Image Library. The image contains a green FOLS2 channel, a red CSF1R channel, and a blue nuclear stain; the workflow extracts the FOLS2 channel and runs the parameter sweep on that 2D marker image.
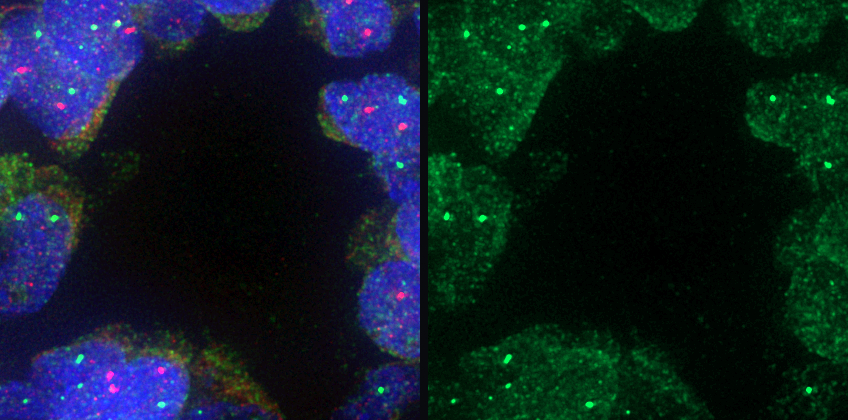
Input preview from a CIL FISH image. The left panel is the merged three-channel crop; the right panel is the extracted FOLS2 marker channel used for ATLAS spot detection.
Run the workflow from the repository root:
python example_workflows/parameter_space_exploration/workflow.py
Workflow Logic
The graph turns a list of images and a list of ATLAS settings into a concrete set of detection jobs.
The important step is the CrossJoin node: it creates one row for every image, p-value, and Gaussian-scale combination, so downstream results keep the parameter values that produced them.
flowchart LR
  image[CIL FISH image]:::source --> files[input_images]:::process
  sensitivity[p_value candidates]:::param --> grid[parameter_grid]:::process
  size[scale candidates]:::param --> grid
  files --> grid
  grid --> channel[extract_marker_channel]:::process
  channel --> atlas[atlas_detections]:::spot
  grid --> atlas
  atlas --> counts[spot_mask_counts]:::metric
  atlas --> mosaic[results_mosaic]:::artifact
  grid --> results[parameter_results]:::metric
  atlas --> results
  counts --> results
  mosaic --> results
  classDef source fill:#e7f0ff,stroke:#4b73b9,color:#1b2f55
  classDef param fill:#fff4d6,stroke:#a77a18,color:#4a3200
  classDef process fill:#edf8ef,stroke:#4d8f5b,color:#173d20
  classDef spot fill:#f3eafd,stroke:#7d57a8,color:#332047
  classDef metric fill:#ffeceb,stroke:#b85b52,color:#4d201c
  classDef artifact fill:#eef6f8,stroke:#4d8794,color:#16343b
input_imageslists the FISH images that will be tested.sensitivity_valuesandsize_valuescreate the ATLAS p-value and Gaussian-scale settings.parameter_gridforms every image/parameter combination.extract_marker_channelextracts channel 0, the FOLS2 marker channel, from each FISH image.atlas_detectionsruns ATLAS for each row in the grid and writes one binary spot mask per setting.spot_mask_countsmeasures each mask by counting connected foreground components and foreground pixels.results_mosaicmakes a quick visual grid of the binary masks.parameter_resultsreturns the parameter values, mask paths, measurements, and mosaic path in one table.
Workflow Outputs
The image output is a mosaic of binary ATLAS masks. Each tile corresponds to one parameter pair; larger or more permissive settings usually produce more foreground, larger components, or merged spots.
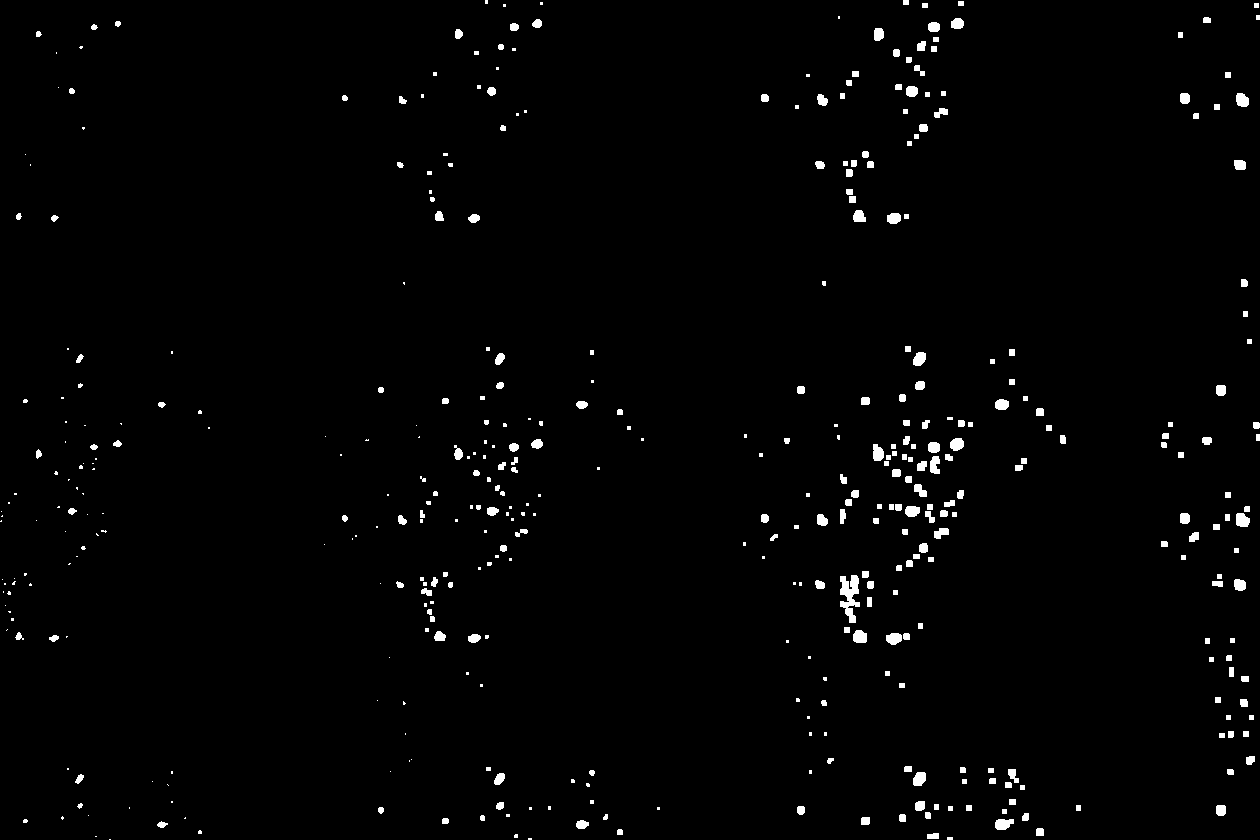
Output preview for the parameter sweep. Each tile is a binary mask generated from the same FOLS2 marker channel with a different ATLAS setting.
The terminal table has one row per image and parameter combination. A typical row looks like this:
path |
sensitivity |
size |
output_image |
label_count |
foreground_fraction |
|---|---|---|---|---|---|
|
|
|
|
|
|
The source path and parameter columns identify the run, output_image points to the ATLAS mask, and the count/fraction columns give a compact numerical summary to compare with the mosaic.